
This article was created with the AI assistant Claude and published by Peter Hoenig.
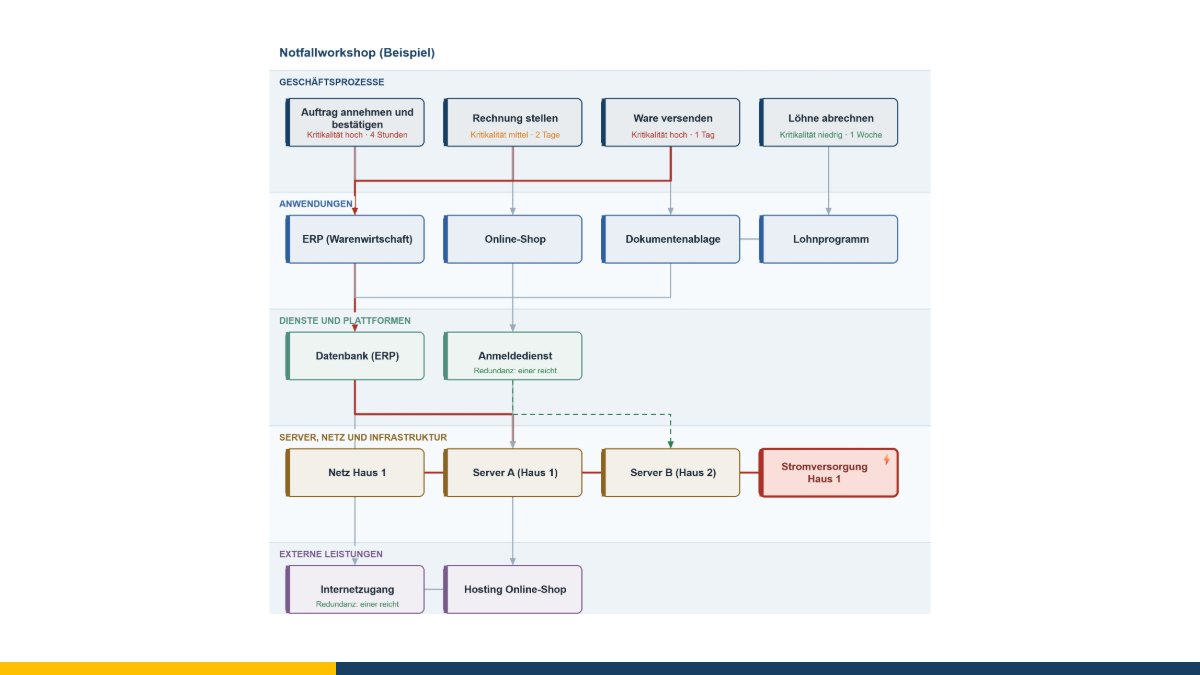
The question almost always comes too late. It is Monday morning, a server is not answering, and everyone in the room is wondering what exactly has stopped. Usually nobody knows for certain. People ring round, try things out, and two hours later it turns out that despatch is affected too – because the warehouse program pulls its article data from a system nobody in the room had thought of.
That question can be answered beforehand, in a workshop lasting half an hour. That is what the outage simulation is for.
How the workshop goes
First the business processes go on the wall – the ones that matter: take an order, despatch goods, issue an invoice, run payroll. Then the applications, services and servers underneath. You connect them with the right mouse button: “connect from here”, then click the target. Every connection means the same thing – needs.
Then the interesting part begins. Somebody clicks the power supply of building 1 and ticks “goes down”. The effect immediately runs up the chain: server A fails, with it the database, with that the ERP system – and with that three of four business processes. The fourth, payroll, stays up because it hangs off a different strand.
That is the moment when a technical drawing turns into a conversation about the business. Because the next question is no longer “which server is that?” but: how long can we live with this?
Representing redundancy honestly
Many dependency diagrams are too pessimistic because they have no notion of standby paths. So for every element you can set how it needs what feeds it:
- all – the default. If one fails, the element fails.
- one is enough – the element only fails once all of its inputs have failed. Two internet providers, two data centres, two directory services.
- at least n of several – for clusters where three of five nodes must be running.
On top of that there is the connection type “stands in (standby path)”, drawn in green and dashed. It absorbs the failure of the ordinary inputs for as long as it is available itself.
The weak-point list
The most useful button is on the right: find weak points. The tool works through every single element and calculates what would happen if that one failed – then ranks the elements by how many business processes they bring to a halt on their own. The current scenario is left untouched.
Whatever sits at the top of that list is a single point of failure: an element with no standby path that more depends on than anyone realised. In my experience it is rarely the most expensive server. More often it is a small service somebody set up on the side years ago and which has been holding everything together ever since – name resolution, a certificate service, a file on a desktop machine.
What the tool is not
It does not calculate probabilities and it does not replace a business impact analysis to ISO 22301. Nor does it check whether the dependencies you entered are correct – it takes them as you write them down. What it does: in a short time it makes visible what hangs together, and it forces the group to make a statement about every single connection. The assessment and the measures remain your decision and belong in your continuity planning.
For downtime and service level agreements there is the availability calculator alongside it, and for the operations view the service tree.
From the workshop into the model
A sketch stays a sketch if it sits in a file. So there is a way in and a way out:
- In: a saved model file from the 8EM modeller is read in. It becomes processes, applications and components; the interfaces maintained there become dependencies, and so do the links between processes and systems. Inside the MC4Y productivity suite the configuration items from the CMDB come along too.
- Out: a table that the modeller reads via “Import › Excel/CSV”. Identical names count as an update there – no duplicates are created.
That makes the outage simulation exactly what it is meant to be: the quick way in, after which you know whether the full model is worth it.
The outage simulation is free of charge and available as free software under the GPL: open the outage simulation. If you would like to put your IT landscape and the processes around it in order as a whole, I am happy to support you with IT-supported organisational consulting – get in touch for a free initial consultation.
Open or download the tools
- Availability and SLA (per cent, downtime, chains)Open Download (439 KB)
- Service catalogue as a treeOpen Download (434 KB)
- 8EM modellerOpen Download (3.3 MB)
- Outage simulation (what fails if this one fails?)Open Download (445 KB)
Thinking further
You can find more on this topic under enterprise architecture management consulting – or talk to me directly in a free initial consultation.
Comments
Comments are published immediately with your name. Only the name, title, comment text and time are stored – see the privacy policy.
Loading comments …