
This article was created with the AI assistant Claude and published by Peter Hoenig.
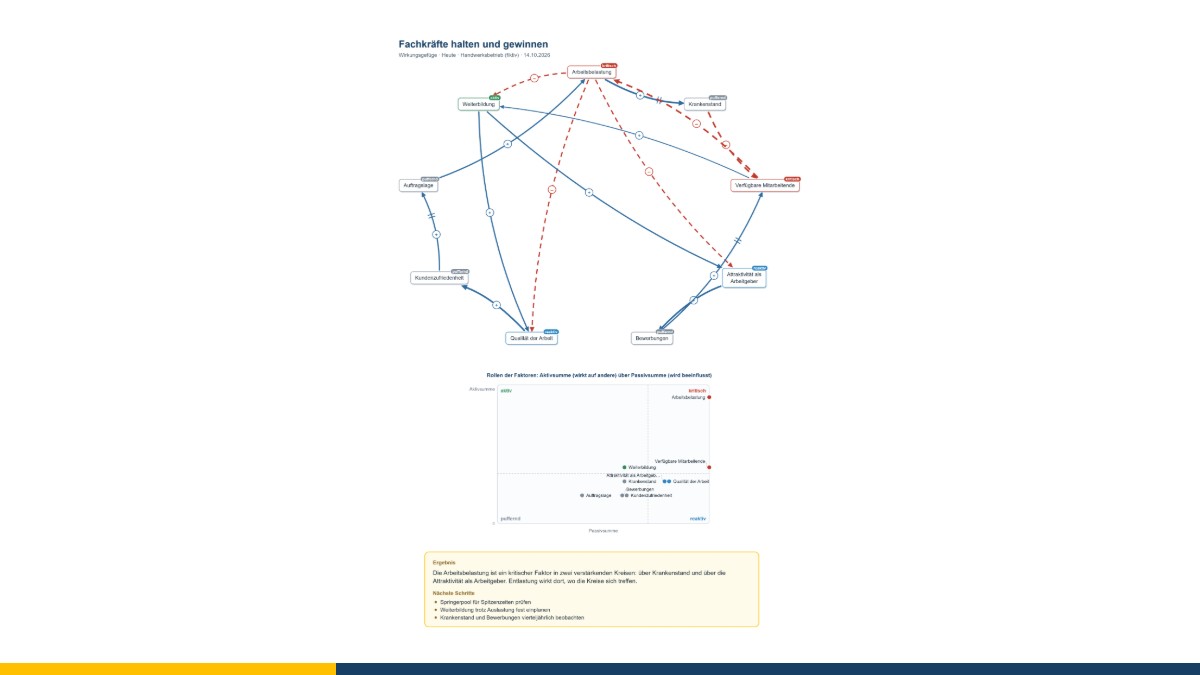
“We need more skilled workers” – and then what? More staff reduces the workload, a lower workload reduces sickness absence, lower sickness absence increases the available working time … Many issues in companies are connected in loops like this. If you only look at one cause and one effect, you overlook feedback loops – and are surprised when well-intentioned measures fizzle out or have side effects. An impact network makes the connections visible.
At a glance
- An impact network shows how the factors of an issue influence one another.
- The influence matrix classifies each factor by its effect on others and by how strongly it is influenced itself.
- This results in roles: active, critical, reactive and buffering.
- Feedback loops reinforce a development or balance it out.
- The free impact network editor calculates roles and feedback loops from your assessments.
Purpose of the method
The impact network helps you to understand an issue as a system rather than as a chain. It answers questions such as: where is the best place for us to start? Which variables are better suited to observing than to steering? Where could an intervention have unexpected consequences?
The roles provide pointers: an active factor has a strong effect on others and is itself influenced little – a possible lever. A critical factor has a strong effect and is strongly influenced; it accelerates developments, and interventions call for caution. A reactive factor is strongly influenced and has little effect – it is suitable as an indicator. A buffering factor has little effect and reacts little, and it stabilises the system. Finally, feedback loops are circles: a reinforcing loop builds up – for better or for worse – while a balancing loop stabilises.
Where the method comes from
The biochemist and systems researcher Frederic Vester made interconnected thinking well known in Germany. As early as the 1970s, he presented a simple influence matrix that he called the “paper computer”: each factor is assessed according to how strongly it influences each of the others; the row and column totals produce the roles. He described the approach in detail in his book “Die Kunst vernetzt zu denken” (1999). Today, interconnected thinking is widely used in management, planning and consulting.
How to create an impact network
- Name the issue and collect factors – as variables (“workload”, not “too much work”). Around 7 to 20 factors have proved effective.
- Enter the effects: does A affect B? In the same direction (more leads to more) or in the opposite direction (more leads to less)? How strongly? With a time delay?
- Evaluate the influence matrix: which factors are active, critical, reactive or buffering?
- Look for feedback loops and discuss them.
- Define starting points and indicators – and check what side effects an intervention might have.
Working with the impact network editor
- Factors and effects: enter factors on the left or place them in the picture; drag effects to their target with the mouse using the handle. Each effect has a direction (+ or –), a strength (1 to 3) and, if you wish, a delay.
- Influence matrix: faster when there are many effects: click in a table to set which row affects which column.
- Evaluation: the active and passive sum of each factor, its role and a role chart beneath the network; all feedback loops with their type, highlighted with a click.
- Several pictures: for example the current state and a picture after planned actions; the report shows the changes.
- Saving and export: save as a file, a printable report with influence matrix, roles and feedback loops, export as PDF, PowerPoint, LibreOffice Impress, Visio, SVG, PNG and as a table for Excel.
The editor runs entirely in your browser and does not transmit any data. It is free of charge and available as free software under the GPL: Open the impact network editor in your browser.
The impact network is a model for reflection and dialogue. The roles result solely from your assessments; it is neither a simulation nor a forecast.
Conclusion
If you know the loops in which an issue runs, you will find better levers and avoid undesirable side effects. If you would like to think through a complex issue in your company together, I will be glad to support you with business change management or by facilitating a workshop. Contact me for a free initial consultation.
Sources: Vester, F. (1976): Ballungsgebiete in der Krise. Stuttgart: Deutsche Verlags-Anstalt. – Vester, F. (1999): Die Kunst vernetzt zu denken. Ideen und Werkzeuge für einen neuen Umgang mit Komplexität. Stuttgart: Deutsche Verlags-Anstalt.
Thinking further
You can find more on this topic under resources and downloads – or talk to me directly in a free initial consultation.
Comments
Comments are published immediately with your name. Only the name, title, comment text and time are stored – see the privacy policy.
Loading comments …