
This article was created with the AI assistant Claude and published by Peter Hoenig.
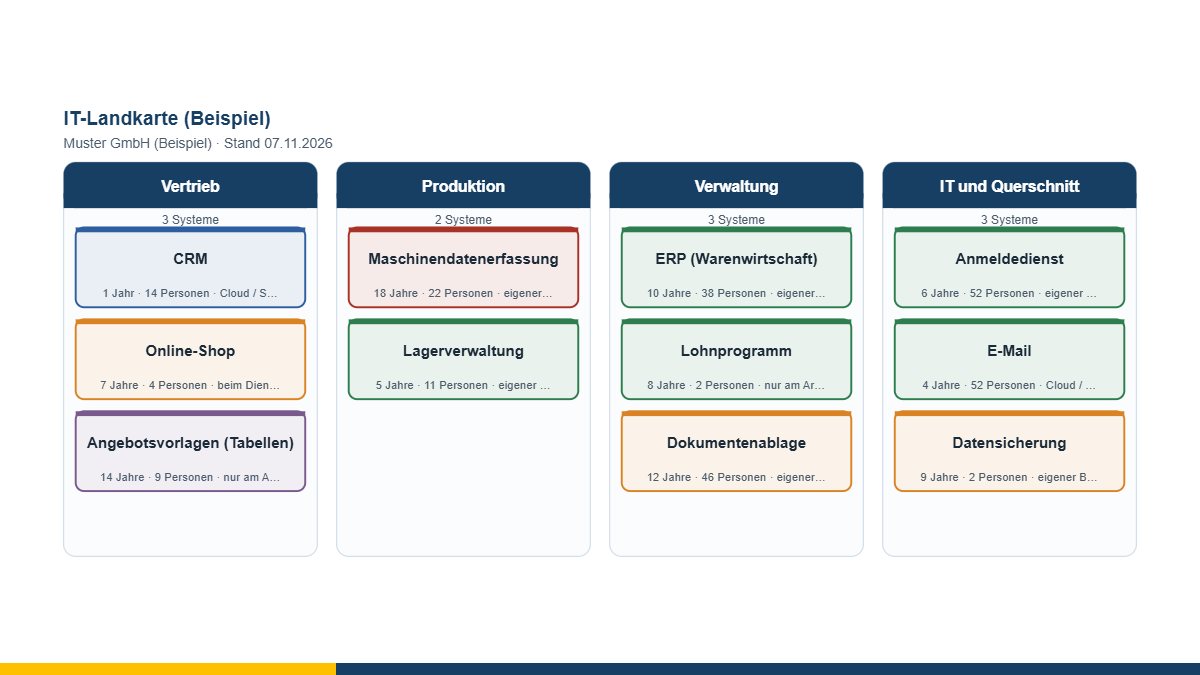
In many small and medium-sized companies there is no list of IT systems. Not out of negligence, but because the occasion never arose: every system came along on its own, out of a single need, and was looked after by whoever wanted it. Ask how many there are and the estimate is regularly out by half – downwards.
The IT map is made for exactly that moment: the workshop in which somebody writes down, for the first time, what there is.
Completeness before precision
The most important rule in this workshop: better a roughly named system than a gap. “Some program the technicians use to record machine data” is a usable entry. It will be made precise later. A system nobody mentioned, on the other hand, will not be mentioned next time either – and will only surface when it fails or when the invoice for it arrives.
That is why the map is organised by business areas, not by IT categories: sales, production, administration, shared services. You then ask people along the lines of their own world, and nobody has to decide whether something is an “application” or a “platform”.
Two numbers that say more than any description
If they come easily, record two things: the year of introduction and the number of people who work with it. Both are available in seconds in any workshop, and both say more about the importance of a system than a description does.
It becomes particularly revealing when you switch the map from “condition” to “age”. Suddenly systems stand out that the group has just rated as “running” – because it has been running for fourteen years, on two particular machines, with a browser version that no longer exists. That is not a contradiction; it is a question worth asking while there is still time.
What the map points out
The tool does not just count, it also looks:
- Systems with no assessment.
- The same name more than once – either the same system in several areas (then merge them) or genuinely several installations, which is a story of its own.
- Systems in service longer than the threshold you set (ten years by default).
- Missing user numbers, because they are the quickest hint at what really matters.
And then: the way into the model
A sketch that stays in a file was a pleasant afternoon. So the transition is the most important thing about this tool.
The connection produces a table that the 8EM modeller reads via “Import › Excel/CSV”. There the tiles become elements that can be assessed (in business and technical terms), linked to processes and capabilities and put into a roadmap. Identical names count as an update in the modeller – so you can hand the map over again six months later without creating duplicates.
From there the next steps follow: the same systems become dependencies in the outage simulation and places where information lives in the data map. And when the group asks after the workshop what should actually be done, the architecture target picture helps – it takes the findings of the map as its starting position.
What the map is not
It is a snapshot from a conversation, not an audited inventory. Before decisions are taken the figures need checking, especially user numbers, contracts and costs – the last of which the map deliberately does not record at all, because estimates made in a workshop are, in my experience, unusable.
The IT map is free of charge and available as free software under the GPL: open the IT map. If you would like to put your IT landscape in order and turn it into a roadmap, I am happy to support you with IT-supported organisational consulting – get in touch for a free initial consultation.
Open or download the tools
- 8EM modellerOpen Download (3.3 MB)
- Outage simulation (what fails if this one fails?)Open Download (445 KB)
- Data map (information objects and their systems)Open Download (440 KB)
- Architecture target picture on one pageOpen Download (436 KB)
- IT map in 30 minutesOpen Download (432 KB)
Thinking further
You can find more on this topic under enterprise architecture management consulting – or talk to me directly in a free initial consultation.
Comments
Comments are published immediately with your name. Only the name, title, comment text and time are stored – see the privacy policy.
Loading comments …