
This article was created with the AI assistant Claude and published by Peter Hoenig.
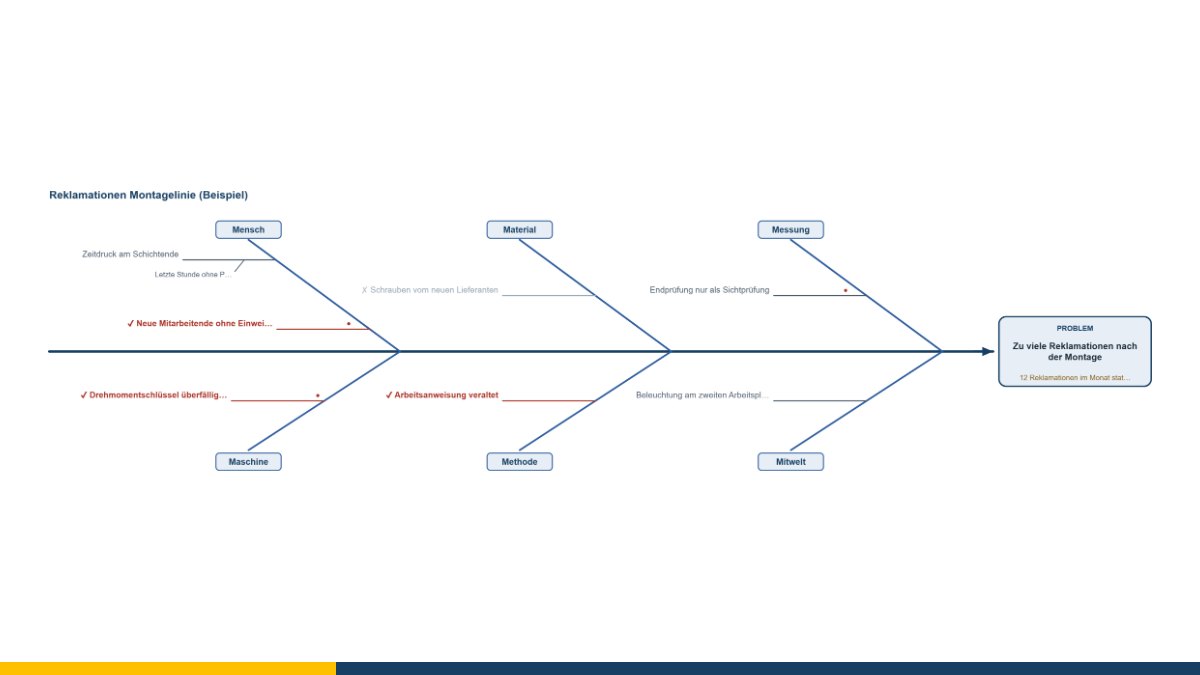
The cause-and-effect diagram, named after its inventor Kaoru Ishikawa and known as the fishbone because of its shape, is one of the best-known tools in quality work. It is also one of the most frequently misused. In many meetings it produces an impressive graphic full of guesses – and then nothing happens, because nobody knows which of them is true.
That is why my tool asks a question about every cause that most templates leave out: how do we know that?
Why the categories help – and when they do not
Sorting causes into people, machines, materials, methods, measurement and environment has one simple purpose: it stops a group from latching on to the first plausible explanation. Whoever finds nothing more under “machines” is then asked about “measurement” – and may discover that the problem does not exist at all, it is merely being measured differently than before.
In manufacturing the six categories fit well. In an office or a service business they often feel forced. So the names can be changed: processes, information, tools, collaboration, environment, rules – whatever fits your case. All that matters is that there are several categories and that each one gets asked.
Incidentally, a main branch with nothing under it is rarely a sign that there is nothing there. The tool points this out.
Collect first, assess afterwards
The order matters, and it is nearly always broken. While collecting, everything goes on the wall without anyone objecting that it is nonsense. Only afterwards does the assessment begin – together, and with one clear question per entry: is this evidenced?
Evidence is something you can show. “The calibration label on the torque wrench is from last year and the deadline was February” is evidence. “That thing is certainly out of calibration” is not. The difference sounds pedantic and is the whole difference between an analysis and a round of opinions.
Just as important: causes that have been checked and ruled out stay on the diagram. Otherwise somebody will ask about the screws from the new supplier again at the next meeting – and nobody will remember that fifty of them went to the laboratory and all were within tolerance.
The diagram is not the end
An Ishikawa diagram sorts and makes visible. It does not weight anything and it calculates nothing. Which cause is really the decisive one only emerges from checking – and sometimes only from trying.
So every cause in the tool has a button that hands it over to the five whys. There a keyword turns into a chain that keeps asking until the answer no longer points at a symptom but at a process or a rule. The diagram says where to look, the why-chain says how deep.
The other way round, the tool takes lessons learned from an incident timeline as causes – turning the review of a single outage into the analysis of a recurring pattern.
From the diagram to the knowledge base
Evidenced causes with a measure are exactly what a knowledge base should contain: symptom, cause, what helps. So they can be transferred into the knowledge base of the ITSM tool – via a file or, if the tool is running inside the MC4Y productivity suite, straight into the shared database. The entries arrive there as drafts and are to be checked before release.
That is the point where quality work and IT operations speak the same language: a well-analysed cause is worth the same in both worlds.
The cause-and-effect diagram is free of charge and available as free software under the GPL: open the cause-and-effect diagram. If you would like to tackle recurring problems in your processes at the root, I am happy to help – get in touch for a free initial consultation.
Open or download the tools
- Five whys (chain of causes)Open Download (433 KB)
- Incident timeline and reviewOpen Download (444 KB)
- ITSM tool (incidents, problems, changes)Open Download (992 KB)
- Cause-and-effect diagram (Ishikawa, fishbone)Open Download (436 KB)
Thinking further
You can find more on this topic under process management consulting – or talk to me directly in a free initial consultation.
Comments
Comments are published immediately with your name. Only the name, title, comment text and time are stored – see the privacy policy.
Loading comments …