
This article was created with the AI assistant Claude and published by Peter Hoenig.
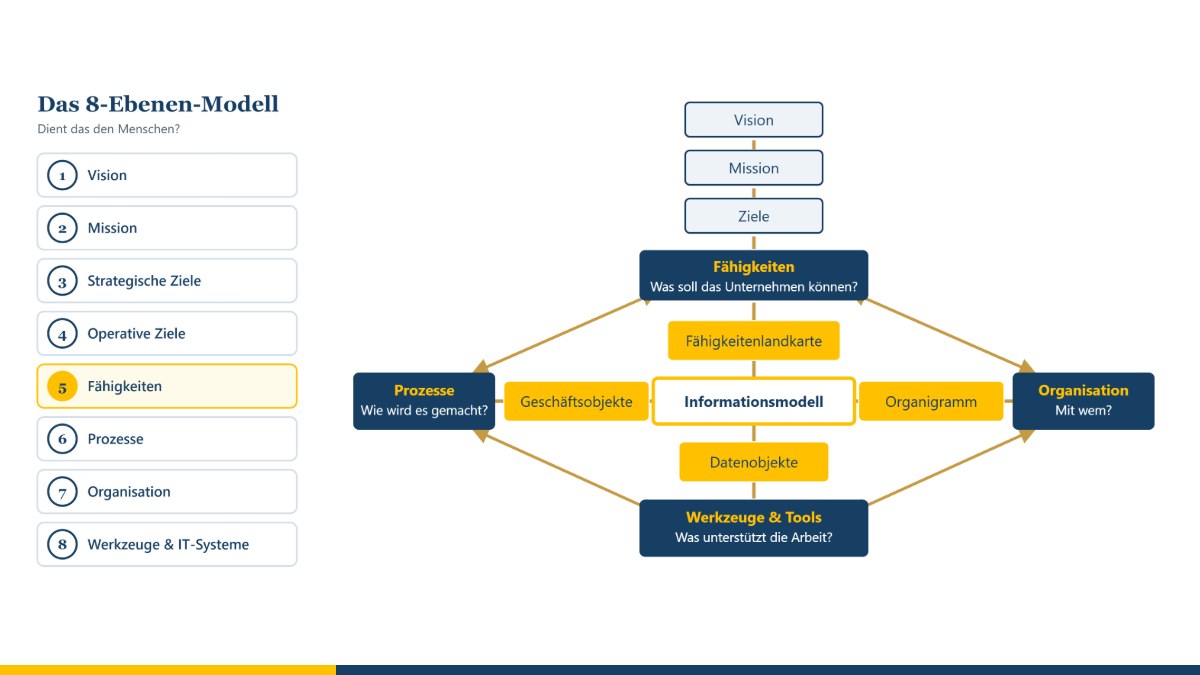
Many change projects in companies start with the software – and later wonder why so little has changed. My 8-Level Model (8EM) takes the opposite route: it starts with the vision and asks, level by level, what follows from it – right down to tools and IT systems. The guiding question is always: Does it serve people? With the 8EM Modeller, a company can be mapped across these levels, linked up, planned for the future and analysed.
The aim of the method
The 8EM makes visible how the parts of a company fit together: Which goals are derived from the vision and the mission? Which capabilities does the company need for them? Which processes put these capabilities into practice, who is responsible for them, and which tools and IT systems support them? This makes gaps and contradictions recognisable early on – for example an IT system that supports no process, or a strategic goal for which nobody is responsible.
The eight levels are: vision, mission, strategic goals, operational goals, capabilities, processes, organisation, and tools and IT systems. In the Modeller, sub-levels complete the picture where practice requires it – for example architecture principles, products, value streams, functions, projects, data and information, a glossary and the locations.
Where the ideas come from
The 8EM is my own compilation, based on experience from IT projects since 1989. It draws on ideas from several disciplines:
- Enterprise architecture management: In 1987, John Zachman described a framework for describing a company from different perspectives. Further frameworks followed later, such as TOGAF®. What they have in common is the idea of looking at business, data, applications and technology as a connected whole.
- Capability orientation: Capabilities describe what a company must be able to do – regardless of how it is organised today. They are a stable link between strategy and implementation.
- Process modelling: The event-driven process chain (EPC) was developed in 1992 by Gerhard Keller, Markus Nüttgens and August-Wilhelm Scheer. Business Process Model and Notation (BPMN 2.0) has been a standard of the Object Management Group since 2011. SeeMe is a notation for socio-technical systems developed by Thomas Herrmann at Ruhr University Bochum; it is particularly good at depicting people, activities and vagueness.
- IT governance and IT service management: Ideas from COBIT® (goals cascade, responsibilities) and ITIL® (service catalogue, continuity) are incorporated wherever they help small and medium-sized enterprises.
- Organisational development and coaching: The question of whether a change serves people stands above all levels.
How the 8EM is applied
- Start with vision and mission: What does the company stand for?
- Derive strategic and operational goals.
- Describe the capabilities required for them.
- Capture the processes that put these capabilities into practice.
- Assign organisation, roles and responsibilities.
- Assign tools and IT systems to the processes.
- Check the links: Where is something missing? Where is there duplication? What serves people – and what does not?
- Design a to-be picture and plan the route there.
Working with the 8EM Modeller
Overview and links
In the overview, all levels are shown one below the other, each element as a card. You draw links between the levels and relationships within a level with the mouse; lines can be curved, labelled and given arrows. Double-clicking a card opens the appropriate editor. A matrix, a guide and a check for missing or contradictory information complement the overview.
What supports what? What is a prerequisite for what? What conflicts?
Between goals, architecture principles, capabilities, products, value streams, processes and projects you record how they affect each other – within one level as well as between levels:
- supports: progress here brings the other one closer.
- is a prerequisite for: without this one the other cannot be reached.
- conflicts with: a goal conflict – more of one means less of the other.
You set the relationship on the right at the element (choose the type and the counterpart) or in the overview via “Connect as: supports | is a prerequisite for | conflicts with”. Goal conflicts appear as ⚡ on the card; for each one you record the decision on the line – priority, balance or a changed goal. The report “Influence relationships and goal conflicts” and the check show which conflicts are still open, where prerequisites go round in a circle and where something supports and conflicts at the same time. The meanings are the same as in the goal system tool; what you hand over from there arrives with these relationships.
An editor for every level
- Texts: For vision, mission, goals and project charters there is an editor that works like a word processor – with an outline, guiding questions for each section, building blocks and a quality check (for operational goals, for example, according to SMART). The result can be output as a Word document.
- Graphical models: capability map, product model, value stream map, process map, function tree, organisation chart, data model, location model, IT system landscape, components and catalogues, service catalogue, as well as models for data protection, measures, risks and cost centres. You work as in a drawing program: drag symbols from the palette, place them freely, enlarge them, nest them inside one another, connect them. Coloured heatmaps show, for example, maturity, lifecycle or protection requirements.
- Process flows: For each process, models can be drawn as EPC, BPMN or SeeMe. Roles, functions, data and IT systems in the flow are automatically created as elements of the appropriate level and linked.
- Software: For IT systems and components there is a UML tool with all 14 diagram types of UML 2.5.1; class diagrams can be generated from the data model. The UML tool is also available on its own, without a company model; it can import diagrams from a model file.
- Tables: Technical architecture plans are edited as a grid – with import and export for Excel.
All graphical models can be output as PDF, PowerPoint, LibreOffice Impress, Visio, SVG and PNG or saved directly in the level's document store.
As-is and to-be
Alongside the current state, you can create as many to-be pictures as you like, for example “Target picture 2027”. Each to-be picture starts as a copy of the previous one and can then be changed freely without affecting the earlier pictures. The Modeller shows what is new, what has changed and what is dropped, and summarises the route as a roadmap.
Analysis and reports
Questions can be asked in everyday German – for example „Wie viele IT-Systeme gibt es im Ist, und wie sind sie mit anderen Ebenen verbunden?“ (“How many IT systems are there in the as-is, and how are they connected to other levels?”) or „Was kosten die IT-Systeme?“ (“What do the IT systems cost?”). The answer is a short report with key figures, charts and tables. In addition, there are around 40 ready-made reports, for example on capabilities and maturity, processes and IT, responsibility, data protection, risks, costs or the change between as-is and to-be, as well as report packs for senior management, data protection, IT and the business departments. Reports can be output as PDF, Word document or CSV table.
Responsibility, data protection, security and costs
- Roles and people are managed centrally in the organisation; everywhere else they are only selected or created on the spot – so there are no names that are not assigned anywhere. Responsibilities can also be recorded as RACI; for people, you can see whether they are employed internally, externally or via a service provider.
- Data protection: a record of processing activities under Art. 30 GDPR with a threshold check for a data protection impact assessment, external parties including data processors, and technical and organisational measures under Art. 32 GDPR.
- Information security: protection requirements for confidentiality, integrity and availability, which are passed on from processes and data to IT systems, platforms, components and locations; a risk analysis based on the elementary threats of the German Federal Office for Information Security (BSI); and a Statement of Applicability with the numbers of Annex A of ISO/IEC 27001:2022.
- Costs: Costs are recorded as entries with a cost type and a cost centre – as planned, forecast or actual. Cost types are suggested and can be added to; cost centres are maintained centrally. The cost report shows budgets, utilisation and the largest cost drivers, the analysis “Cost centre × cost type” all costs as a table – with CSV for your spreadsheet.
- Master data: Cost centres, cost types, organisational units and locations can be linked to my master data tool. In the as-is picture, the master data then lead for name, number and classification; to-be pictures stay as you planned them. New cost centres and cost types in use go into the master data – and thus into all connected tools.
Tools for architecture management
The application portfolio, migration assessment, interface catalogue, technology radar, prioritisation of initiatives, architecture decisions, value streams, glossary and exchange via the ArchiMate® format are all included in the Modeller. You can read more in the post Architecture management tools in the 8EM Modeller.
IT systems, platforms and the CMDB
For the lowest level, there is a large input form in addition to the sidebar, for IT systems, technical architecture plans, platforms, IT components, catalogues and ICT objects: all details in sections – from the profile through responsibility, interfaces and data to continuity and costs.
- Lifecycle with dates: idea, project, introduction, operation, decommissioning planned, decommissioned – one date per phase. The status follows from these dates: in the as-is as of today, in a to-be picture as of its target date. So the 2028 target picture automatically shows which systems will have been decommissioned by then. The same six phases apply to IT services and products; for products the development in the market (introduction, growth, maturity, decline) is kept as a separate “market phase”. The Modeller takes over older models when they are opened.
- Interfaces: An interface sends or receives data; if data flows in both directions, there are two. You select the transferred data from the data model or create it there; each interface has a status in the same six phases – from “idea” to “decommissioned”. There, too, you assign the data objects that a system manages and the functions it supports.
- Context diagram: one system in the centre, with the surrounding systems arranged around it up to five steps away – interfaces by status and systems by lifecycle can be shown and hidden.
- Standardisation and operation: in addition to the existing standardisation, the classification as in-house development or purchased solution, in each case as standard or non-standard, the department responsible on the business side and the one responsible for IT, and where a system runs – in-house or with a cloud or hosting provider. The technology radar shows both views of standardisation.
- Platform layer and nested platforms: In technical architecture plans (TAP) and platforms, the bottom row across all tiers is the platform layer. Platforms can be nested in it, because a platform has a platform layer of its own as well. Every grid shows the building blocks of all platforms below – each platform in its own colour, in the cell with the same row and column label. A platform can appear in many TAPs; the TAP itself is the top element and belongs permanently to exactly one IT system.
- ICT objects: Anyone who creates a new IT system, platform or component is offered suitable ICT objects for bundling or can create a new one; releases and versions are added automatically.
- CMDB: In my MC4Y Productivity Suite, the Modeller transfers IT systems, architecture plans, platforms and components to the CMDB when saving – with the lifecycle phase as status; anything already maintained there is kept. The relationships are added – such as interfaces, “uses” and “runs on” – as well as the costs of the IT elements by cost type and cost centre; if costs have been changed in the CMDB, the Modeller does not overwrite them but shows the difference at the element. Conversely, CMDB entries can be assigned in the model. Without the suite, a handover file can be created on request, which the CMDB then imports.
Projects and project management
In the Modeller, you describe projects with a project charter and a project organisation; you link the goals they contribute to and the capabilities, processes and IT systems they change just like all other elements. A project is usually planned and managed elsewhere, however. That is why every project can be connected to my project management tool – in both directions:
- Taking over the project status: Traffic lights for schedule, costs, quality and risks, progress, dates, milestones with planned and forecast dates, costs, risks and team come from the project management tool. The milestone planning goes into the milestone table of the project charter, from which the timeline is drawn; your own rows are kept. If you wish, the Modeller also takes over start and end, costs per cost type as cost entries, the client, the project manager and the project team.
- Synchronising: If the plan changes, one click fetches the latest status. The check reports projects with a red traffic light and postponed milestones; the “Projects” report shows traffic lights, milestones and the milestone trend.
- Handing over a project charter: Conversely, a project described in the model is passed to the project management tool with its goals, assignment, time frame, budget, milestones and participants. A project is created there from it, and its status later comes back.
Invoices, time recording and the details of planning stay in the project management tool; the model contains what matters for the overall view.
Storage and data protection
Each model is kept in its own folder on your computer – with a subfolder for each level for documents, automatic backups and a recycle bin. The Modeller runs in your browser and does not transmit any data. You use the model folders in Chrome or Edge; in Safari and Firefox you work with a single model file.
The 8EM Modeller is still under development. You can download a trial version under Experimental – to try out or open it straight away in your browser; once it has been sufficiently tested, it will move to Resources and downloads. If you want to work on a model together as a team, use it in my MC4Y Productivity Suite, which is also available under “Experimental” – there the model and all its storage folders are kept on the server, and whoever is currently editing it keeps it locked for the others.
The 8-Level Model is a model for description and dialogue. It does not replace specialist advice in individual cases – including legal advice on data protection or information security – nor operational implementation.
Functions at a glance
- Getting started: the start window creates a new model as a model folder with “Choose and create a storage location …” (Chrome, Edge) or as a
.8em.jsonfile with “Create as a single file” (Safari, Firefox). “View example” shows a fictitious model. - Views: “Levels”, “Capability map”, Matrix, Roadmap, “📊 Analysis”, “Guide”, “Document store” and “Check”.
- Undo and history: the large arrows at the top left undo or redo steps; the arrow ▾ between them jumps back several steps.
- Takeovers via “Import ▾”: “🎯 Goal system from the coaching tool”, “🩹 Pain points from the coaching tool”, “📋 Project status from project management”, completed IT survey forms and EAM maturity checks, and “⬆ Bulk import (Excel/CSV)” – this is also how the tables from the IT map and the SIPOC tool get into the model. The bulk import even reads the IT map directly from its saved file: it sets the level and the columns itself, business areas become responsible departments, responsible people become roles of the organisation, and identical names or the same CMDB ID create no duplicates.
- Output via “Export ▾”: “Print / PDF”, “Table (.csv)”, the ArchiMate® exchange format and “📤 Project charter to project management”.
- Questionnaires on the organisation: for units, locations and people, “▶ Values Profile”, “▶ Theory U” and “▶ Compass” open the matching questionnaire; only the shares are taken over, no individual answers. The questionnaires are not scientifically validated; I use Theory U as a reflection and conversation model, not a diagnostic instrument.
Frequently asked questions
What do “supports”, “is a prerequisite for” and “conflicts with” mean in the 8EM Modeller?
They are the three influence relationships between goals, architecture principles, capabilities, products, value streams, processes and projects. “Supports” means that progress here brings the other one closer. “Is a prerequisite for” means that the other cannot be reached without this one. “Conflicts with” is a goal conflict – more of one means less of the other – and you record a decision for it on the line.
Which phases does the lifecycle of an IT system have?
Six: idea, project, introduction, operation, decommissioning planned and decommissioned, each with a date. The status follows from these dates – in the as-is as of today, in a to-be picture as of its target date. The same phases apply to IT services, products and interfaces.
How does an existing list of systems get into the model?
Via “Import ▾” › “⬆ Bulk import (Excel/CSV)”. The bulk import reads the file of the IT map directly: business areas become responsible departments, responsible people become roles of the organisation, and identical names or the same CMDB ID create no duplicates.
Do I need an account for the 8EM Modeller?
No. The Modeller runs straight in your browser, with no sign-up and no installation, and what you enter stays on your device. A trial version is available under Experimental – to try out.
Conclusion
The 8EM brings strategy, processes, organisation and IT together into an overall picture – and puts people at the centre. The 8EM Modeller turns this picture into a working tool: for describing, planning and deciding. If you would like to look at your company in this way, you will find more under enterprise architecture management and process management. Get in touch for a free initial consultation.
Sources: Zachman, J. A. (1987): A Framework for Information Systems Architecture. IBM Systems Journal 26 (3). – Keller, G.; Nüttgens, M.; Scheer, A.-W. (1992): Semantische Prozeßmodellierung auf der Grundlage „Ereignisgesteuerter Prozeßketten (EPK)“. Veröffentlichungen des Instituts für Wirtschaftsinformatik, issue 89, Saarbrücken. – Object Management Group (2011): Business Process Model and Notation (BPMN), Version 2.0. – Object Management Group (2017): Unified Modeling Language (UML), Version 2.5.1. – Herrmann, Th. (2012): Kreatives Prozessdesign. Berlin, Heidelberg: Springer Gabler.
Trademark notice: TOGAF® and ArchiMate® are registered trademarks of The Open Group. COBIT® is a registered trademark of ISACA. ITIL® is a registered trademark of the PeopleCert group. The names are used for descriptive purposes only; there is no connection with the trademark owners. Theory U® and Presencing® are registered trademarks of C. Otto Scharmer (US reg. 5883933 and 5135923); the names refer here only to the underlying model. There is no connection with the Presencing Institute.
Open or download the tool
- 8EM modellerOpen Download (3.7 MB)
Thinking further
You can find more on this topic under resources and downloads – or talk to me directly in a free initial consultation.
Comments
Comments are published immediately with your name. Only the name, title, comment text and time are stored – see the privacy policy.
Loading comments …