
This article was created with the AI assistant Claude and published by Peter Hoenig.
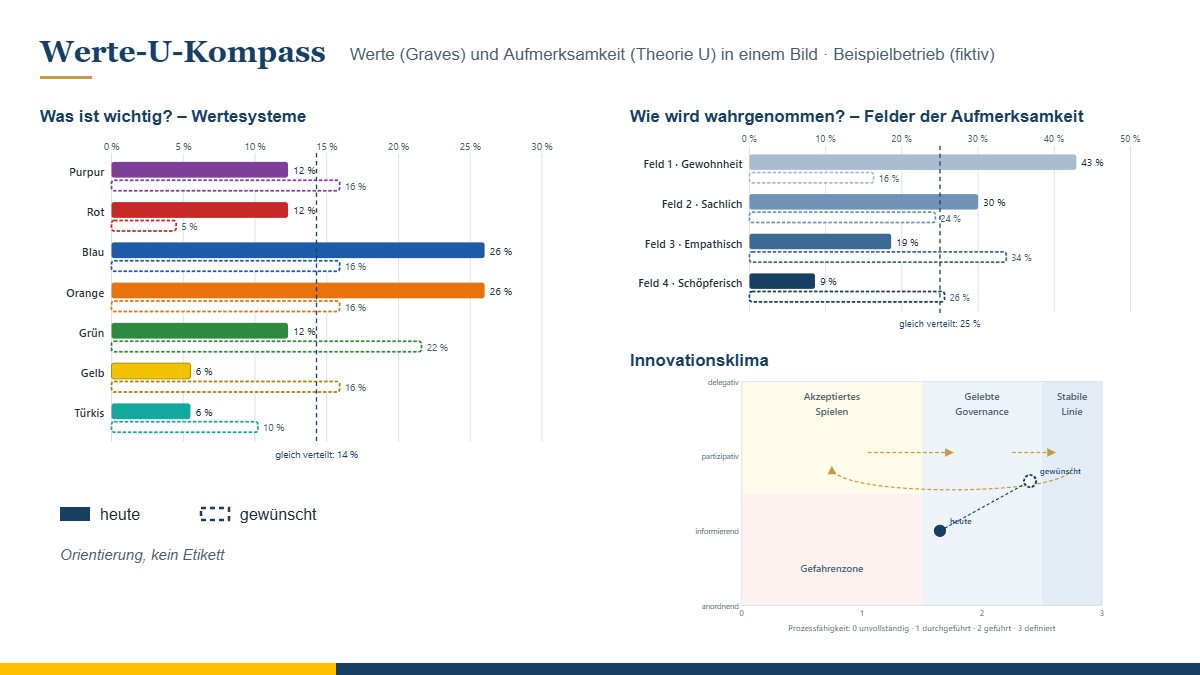
“People are at the heart of everything we do” – you will find this in many mission statements. Whether it is lived in everyday practice shows elsewhere: in meetings, in decisions, in the way mistakes are handled. Between what matters to an organisation or a person and the way things are actually perceived and acted upon, there is often a gap. The values U compass makes both visible in one picture – and shows which next development step suggests itself and how it can succeed.
Why two models together?
Graves's values model uses colours to describe what matters to people and organisations – belonging, drive, order, achievement, community, systemic and holistic thinking. Theory U describes how people perceive and act – out of habit, factually, empathically or generatively – and in which steps something new emerges. Each model is helpful on its own; together they answer a question that each leaves open by itself: is what matters to us actually lived?
For example, anyone who places a high value on community and participation but mainly acts out of habit in meetings is not living up to their own values in everyday life. The connection between the two models is my own interpretation; the compass marks it as such in the result. I describe the two models in more detail in the posts The values profile and The U profile.
How the compass is structured
At the start, you choose whether you are looking at an organisation – the whole company or one area of it – or at yourself, for example to prepare for coaching. The questionnaire then guides you through several parts:
- Values: as in the values profile, across ten topics.
- Attention: the four fields in eight everyday situations.
- Steps in the U process and what holds you back: learning barriers or inner voices.
- Situation, change and conflict: which kind of complexity prevails, whether the conditions for change are in place and how differing interests are dealt with.
- Warning signs: indications of what Scharmer calls “absencing” – such as mistrust, covering oneself, blame or withdrawal.
- Processes and leadership (organisations only): how reliable processes are and how people are led.
The standard version comprises 146 statements for organisations (about 21 to 27 minutes) and 134 for individuals; the full version covers each colour and each field twice as often. Optionally, you can also state the desired state and how things actually are today under pressure. You can save your interim progress at any time.
What the result shows
- What is important? The values profile with the shares of the seven value systems and the balance between “I” and “we”.
- How do we perceive? The shares of the four fields of attention.
- Do values and attention fit together? Which fields would be expected on the basis of the values and which are actually lived – with the largest deviations.
- The situation: whether dynamic, social or emergent complexity predominates, as Scharmer distinguishes them, and which approach then fits.
- Development path: the most natural next development impulse, together with the field of attention and the U step that support it. The compass checks whether the conditions for it are in place using the six conditions for change described by Don Beck.
- Steps in the U process, obstacles and warning signs.
- Innovation climate (organisations only): a picture based on the reliability of processes and the prevailing leadership style – directive, informing, participative or delegating. It assigns the organisation to one of four fields – danger zone, accepted play, governance in practice or stable line – and shows the path from the current to the desired state, with suitable approaches. I developed this model in my master's thesis at the Europäische Fernhochschule Hamburg; you can find it under E-books.
Finally, there are questions for discussion – in the team or with me.
Bringing several perspectives together
If several people complete the compass for the same organisation – or each for themselves, for example in a team – and save their results as files, all the files can be opened together. You select them with “Combine several results” or drag them onto the start page with the mouse. Later you can add further results or take individual ones out again with ×.
- Mean: all sections of the result show the mean of the individual results – from values and fields through the U steps, learning barriers or inner voices, the situation and the prerequisites for change to conflicts, warning signs and the innovation climate.
- Spread and individual profiles: a mean hides differences – two very different points of view can produce the same mean as two identical ones. That is why the section “Differences in the group” shows the lowest and the highest value for every building block and all individual profiles on top of each other, each with its own number, colour and line style. Clicking a name highlights that profile. Where the desired image and “Today under pressure” were recorded in all results, you can switch the view to them.
- Anonymous or with names: by default the individual results appear as “Person 1”, “Person 2” and so on – in the printout and in the saved group file as well. Names are only shown if you explicitly switch them on.
- Nothing is mixed silently: files that do not fit – an interim state, the other perspective, a different questionnaire, incomplete answers or the same file twice – are not included, and the compass states the reason. If not all of them use the detailed version or the desired image, it evaluates only what all of them have in common and says so.
- Saving the group result: the combined result can be printed and saved as a file; when you open it again, the spread and the individual profiles are back.
Large differences are not a mistake but a good occasion for conversation: what does each person experience that leads to their view? Combining results, too, is a means of orientation, not a diagnosis. “View example of a combination” shows four entirely fictitious individual results. Combining also takes place only in your browser – nothing is transmitted.
Data and notes
The questionnaire runs entirely in your browser. Your answers are not transmitted to me or to anyone else. The result can be printed, saved as a PDF or kept as a file. The compass is free of charge and available as free software under the GPL: Open the values U compass.
The values U compass is a trial version and has not been scientifically validated. It is intended as orientation and as a starting point for conversation – the result is a snapshot, not a label. I use the values model and Theory U as models for reflection and dialogue, not as diagnostic instruments; coaching is no substitute for psychotherapy.
Functions at a glance
- “Who are you looking at?” sets the perspective: an organisation or yourself. Under “Scope” you choose “Standard” or the detailed version, under “Additional perspectives (optional)” the desired picture and “Today under pressure”.
- “Start the questionnaire” guides you through the parts; pointing at an answer (tapping on a phone) explains each level with an example for the statement concerned.
- “Save interim state” saves your answers as a file; “Open saved state” carries on at the same page or shows a saved result again.
- “View example result” shows an entirely fictitious result for the chosen perspective.
- “Combine several results” opens at least two saved individual results with the same perspective together (hold down the Ctrl or Shift key, or drag the files onto the start page); “View example of a combination” shows an entirely fictitious group result.
- In the combined result: “Show names” (otherwise anonymous), “Add further results”, × to take one out, clicking a name in the legend highlights that profile, and “Today”, “Desired” or “Today under pressure” switch the view.
- On the result page: “Print / as PDF”, “Save result as file”, “Change answers” and “Start over”.
- If you open the compass from the 8EM Modeller, you hand the result over with “Hand result over to the 8EM Modeller”. The Modeller takes over only the shares of values and fields, not individual answers.
Frequently asked questions
How do I combine the results of a team?
Everyone saves their result as a file. On the start page you choose “Combine several results” or drag all the files in with the mouse. The compass then shows the mean for each building block, the spread from the lowest to the highest value and all individual profiles on top of each other; the group result can be printed and saved as a file.
Can people see in the group result who answered what?
Not unless you decide so: by default the individual results are called “Person 1”, “Person 2” and so on – in the printout and in the group file too. Names only appear if you explicitly switch them on.
Is the values U compass a test or a diagnosis?
No. I use the values model and Theory U as models for reflection and dialogue, not as diagnostic instruments. The compass is a trial version, not scientifically validated, and its result is a snapshot, not a label – the combined result included.
Conclusion
The compass shows whether what matters is also lived – and where the next step can lead. It brings together my work with values and Theory U and is being developed continuously; feedback is very welcome. If you would like to discuss the result or bring together several perspectives in your organisation, I will be glad to support you with business change management and in personal and team development. Contact me for a free initial consultation.
Sources: Graves, C. W. (2005): The Never Ending Quest. Ed. by C. C. Cowan and N. Todorovic. Santa Barbara: ECLET Publishing. – Beck, D. E.; Cowan, C. C. (1996): Spiral Dynamics. Mastering Values, Leadership, and Change. Malden: Blackwell. – Scharmer, C. O. (2007): Theory U. Leading from the Future as It Emerges. Cambridge, MA: Society for Organizational Learning. – Hoenig, P. (2014): Modellentwicklung und Ableiten von Vorschlägen zum Fördern und Durchsetzen von Innovationen in IT-Abteilungen und IT-Unternehmen. Master's thesis, Europäische Fernhochschule Hamburg.
Trademark notice: Spiral Dynamics® is a registered trademark of National Values Center Consulting. The name is used here solely to refer to the underlying model; there is no connection with the trademark owners, and my questionnaires are neither certified nor authorised by them.
Trademark notice: Theory U® and Presencing® are registered trademarks of C. Otto Scharmer (US reg. 5883933 and 5135923). The names refer here only to the underlying model; there is no connection with the trademark owners or with the Presencing Institute, and my tools are neither certified nor authorised by them.
Open or download the tool
- Values and U compass (questionnaire)Open Download (1.2 MB)
Thinking further
You can find more on this topic under resources and downloads – or talk to me directly in a free initial consultation.
Comments
Comments are published immediately with your name. Only the name, title, comment text and time are stored – see the privacy policy.
Loading comments …